
Health inequities in the European Region
Europe is on track to achieve the Health 2020 target to reduce premature mortality from cardiovascular diseases, cancer, diabetes mellitus and chronic respiratory diseases by 1.5 percent annually until 2020. However, there are other challenges for the European Region, like those concerning health inequalities among countries.
Recently, WHO presented the Health Report 2015, published every three years, which aims to collect data from all the WHO databases concerning the main health topics. This edition has two goals: reporting on progress towards the Health 2020 targets in the Region so far, for instance on premature mortality linked to risk factors, life expectancy or the health coverage, and highlighting new frontiers in health information. Data are mainly taken from Health for All database, the Global Status of NCDs 2014 and the EU detailed Mortality database.
Measuring well-being to measure health
A crucial point of this publication, and in general of the WHO efforts, is to monitor health as best as possible, considering all the indicators that can describe the health situation of the Region. The problem is that collecting data may be a complex operation, especially when subjective concepts like well-being are involved.
In 1992, Geoffrey Rose showed, in his book “The strategy of preventive medicine”, a relationship between longevity and life satisfaction. Rose’s data exposed a paradox: yes, we live more, but at the same time we are less satisfied with our life.
Well-being is a key word of this report, and it has been included into the WHO definition of health since 1948. Between health and well-being there is a deep and mutual relationship, and trying to monitor and measure even these subjective concepts is fundamental for a holistic comprehension of the situation.
For this reason, life satisfaction is today one of the indicators WHO has planned to consider in its analysis for the next years. It will be combined with other more “objective” ones like social connection, the economic security and income, the natural and built environment and education.
Too many health inequities, but the sensibility across countries doubled
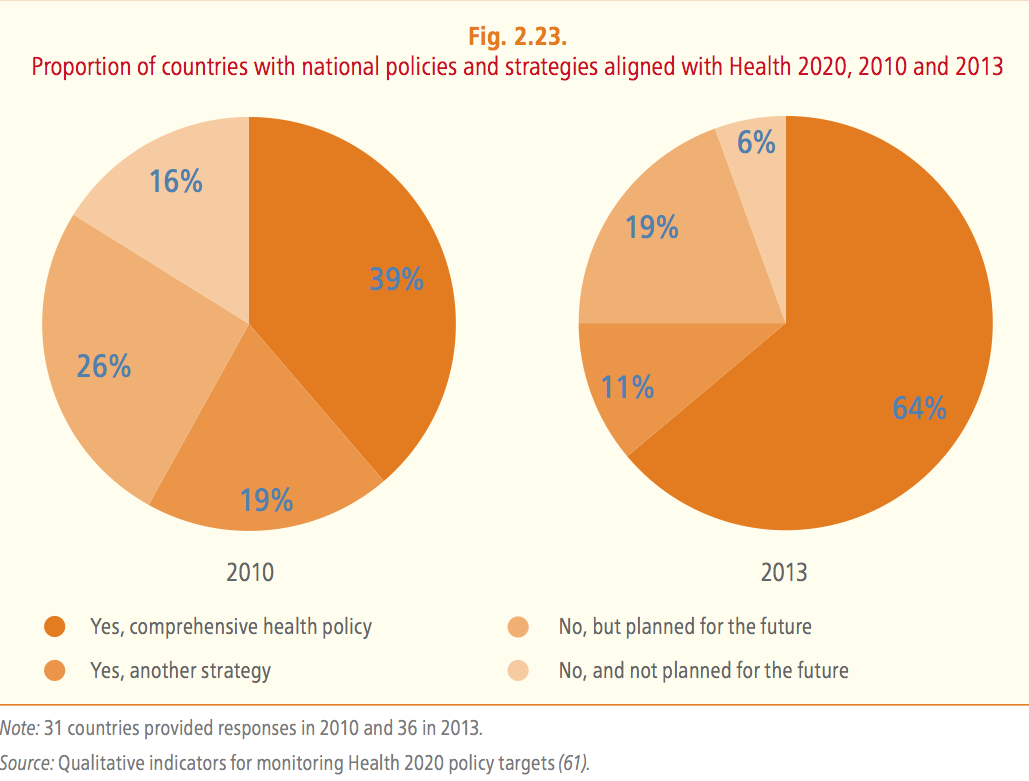
“Health is a political choice” was one of the slogans of the Regional Meeting of the WHO European Region, which took place in Vilnius last week. In 2013, Health2020 was not a concrete reality for all European countries but some significant steps have been taken in this direction since 2010. Between 2010 and 2013, the percentage of countries whose policies were aligned to Health2020 increased from 26 percent to 50 percent.
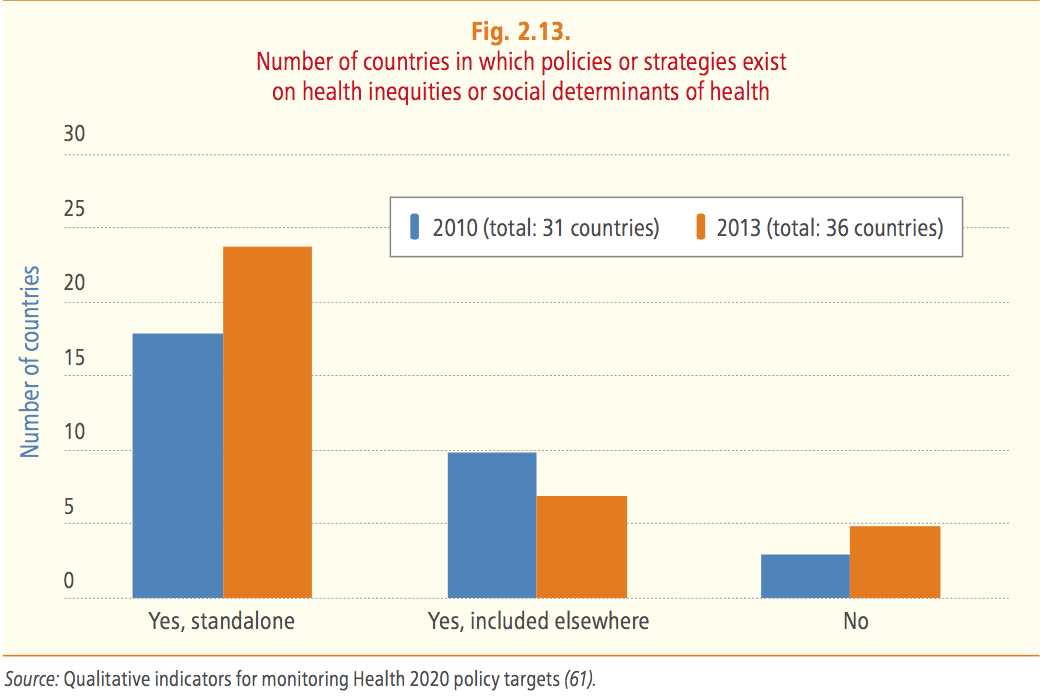
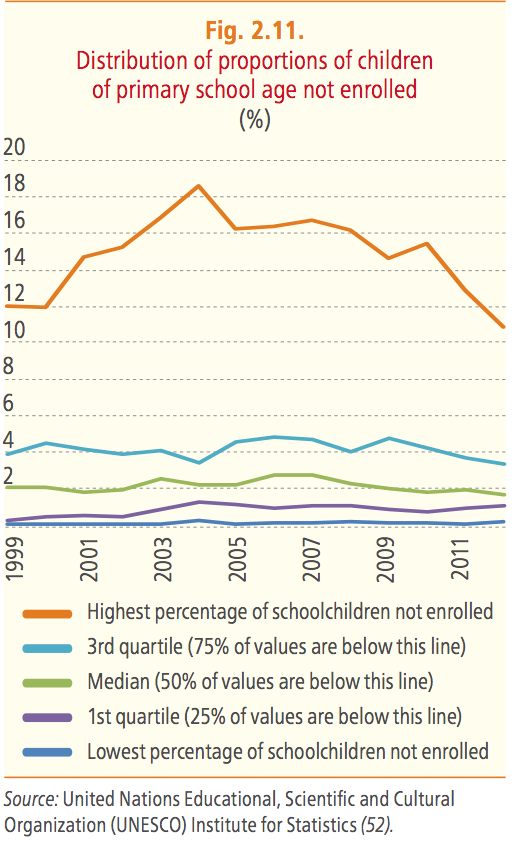
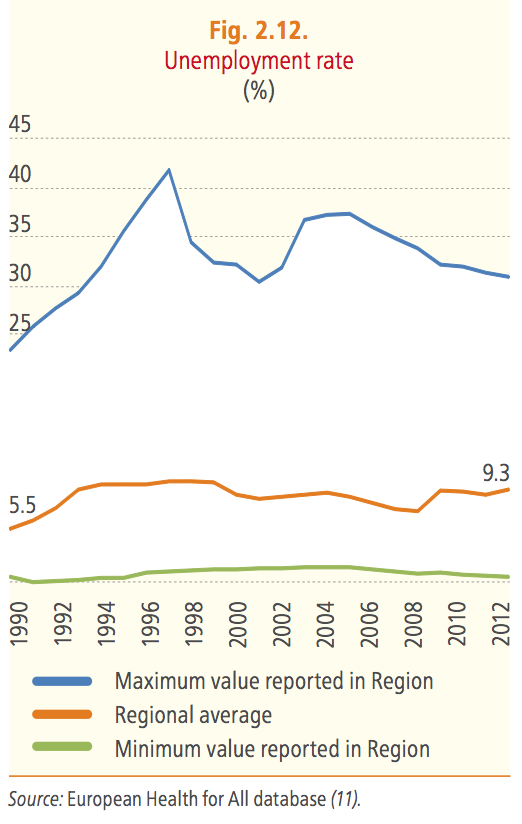
However, such good news does not mean that health inequalities among countries decreased in the same way. Data about school enrolment and unemployment – which are indicators for health inequalities – show deep inequality across the Region.
Europe is not equal about health because it is not socially equal: we cannot forget that social determinants of health (i.e the conditions in which people are born, grow, work, live, and age) are the fuel for health inequalities.
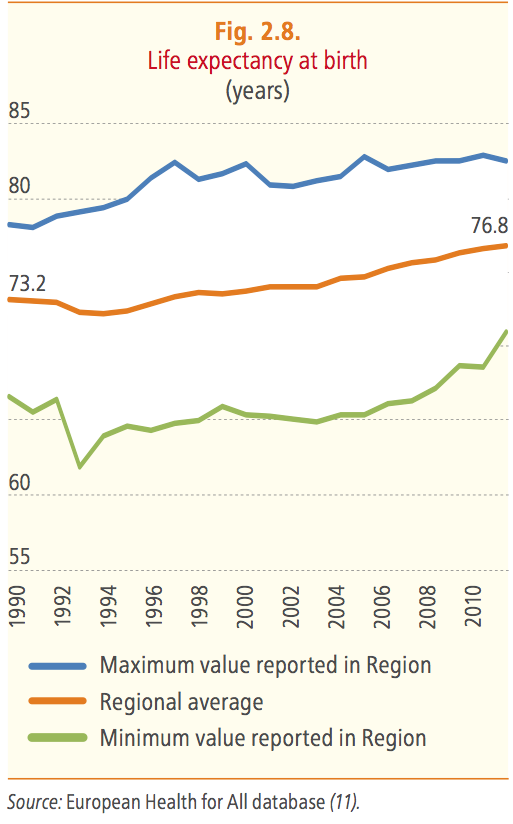
Life expectancy increased and premature mortality decreased, but not for all
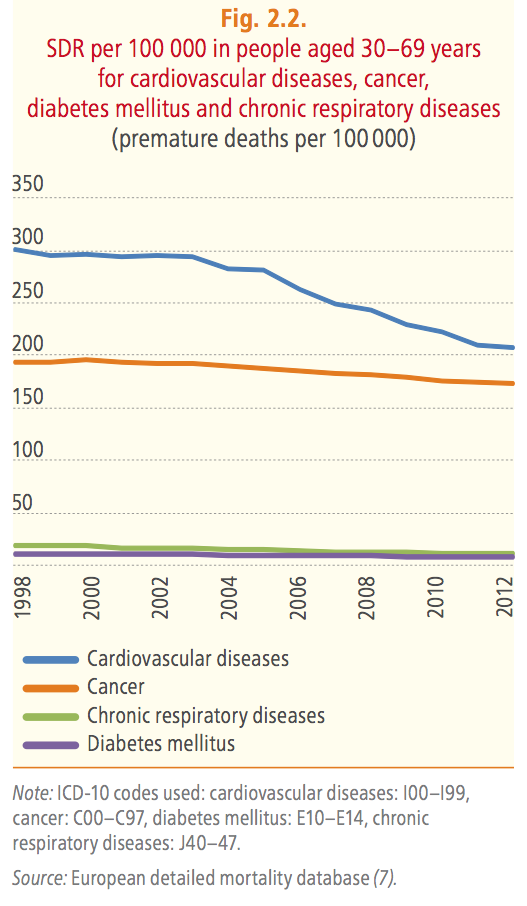
The average annual rate of reduction of premature mortality from the four major NCDs over the first three years of observations (2010–2012) is 2 percent and the Region is, therefore, currently on track to achieve the goal. The main problem remains the lack of data: the number of countries in the Region for which data are available for 2012 is suboptimal: only 28 out of 53.
The two main causes of death in Europe are cancer and cardiovascular disease. Although the death rate for cancer has fallen gradually since mid-2000s, the proportion of overall premature mortality from this cause has increased as the death rate from cardiovascular disease has dropped faster. In 1998, cancer accounted for just over one third (37 percent) of premature mortality, and this has risen consistently to 43 percent in 2012.
On the other hand, chronic respiratory diseases and diabetes mellitus account for the smallest share of premature deaths, at about 6 percent combined, a percentage unchanged over time.
The crucial point is represented – again – by inequalities among countries, in some cases very marked, and linked to the prevalence of the risk factors among the population.
Alcohol, tobacco, obesity: the levels are still too high
Although the prevalence of risk factors like tobacco use and alcohol intake is still high in most Europeans countries in comparison with other WHO regions, the footprint of these risk factors is becoming lighter year after year.
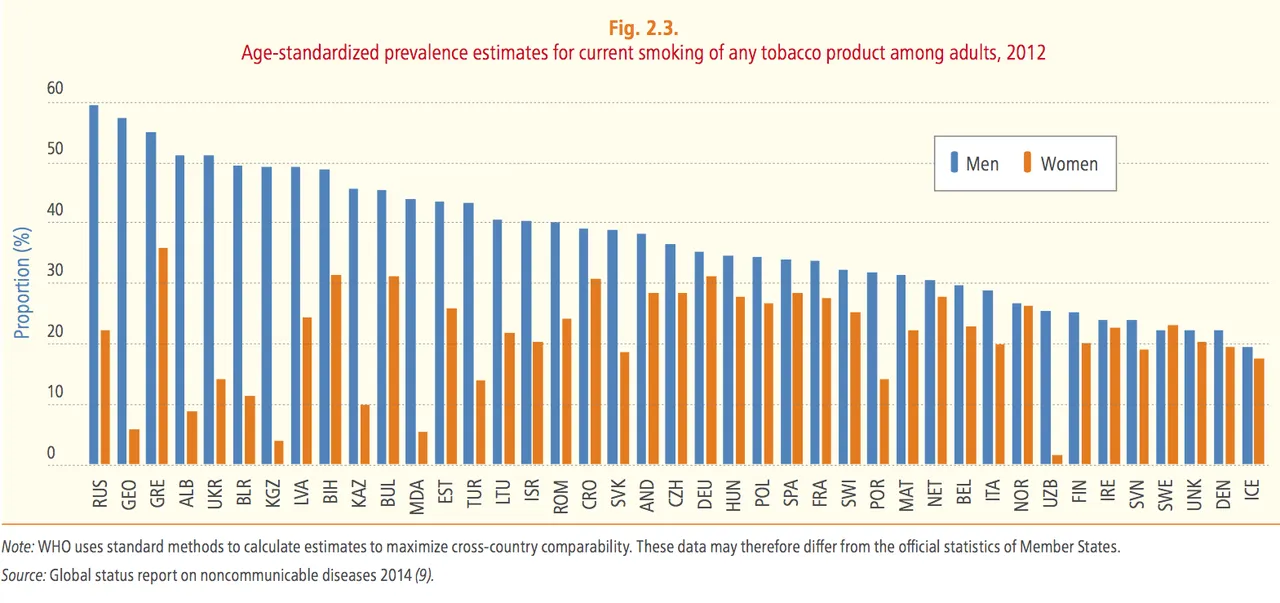
Between 2010 and 2012, the prevalence of tobacco use among adults decreased in 39 of the 41 countries for which WHO carries out the study. However, statistics show that only 11 countries in the Region are likely to meet the 30 percent reduction target of the global NCD monitoring framework by 2025. In 2012, the European Region had the highest regional average rate of tobacco use at 30 percent, although the rate varies considerably between countries. It also had the highest regional average rate of tobacco use among women.
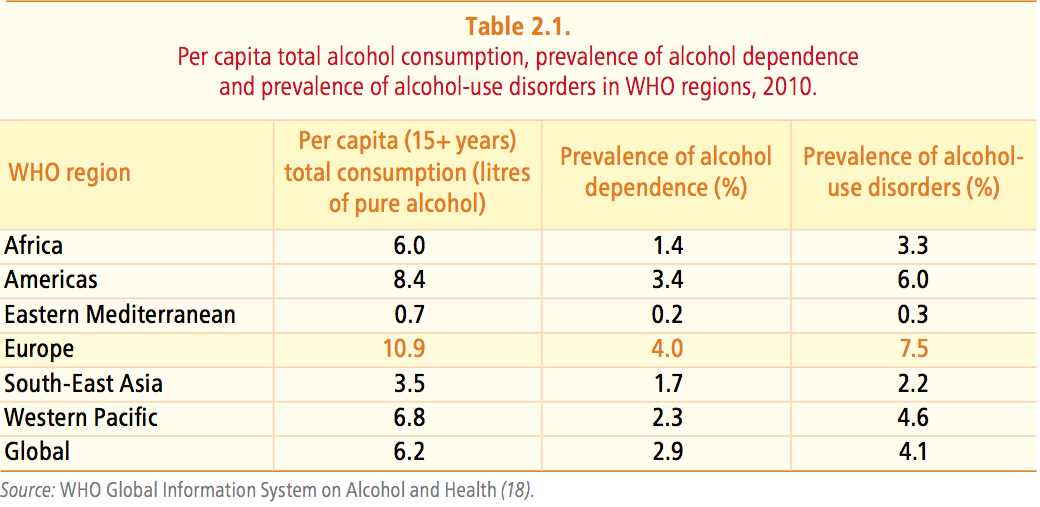
Alcohol intake in the European Region is the highest in the world, resulting in a higher prevalence of alcohol dependence and alcohol-use disorders than in other WHO regions. Nevertheless, levels of alcohol consumption vary greatly between European countries, ranging from 0.32 to 14.37 litres per capita annually.
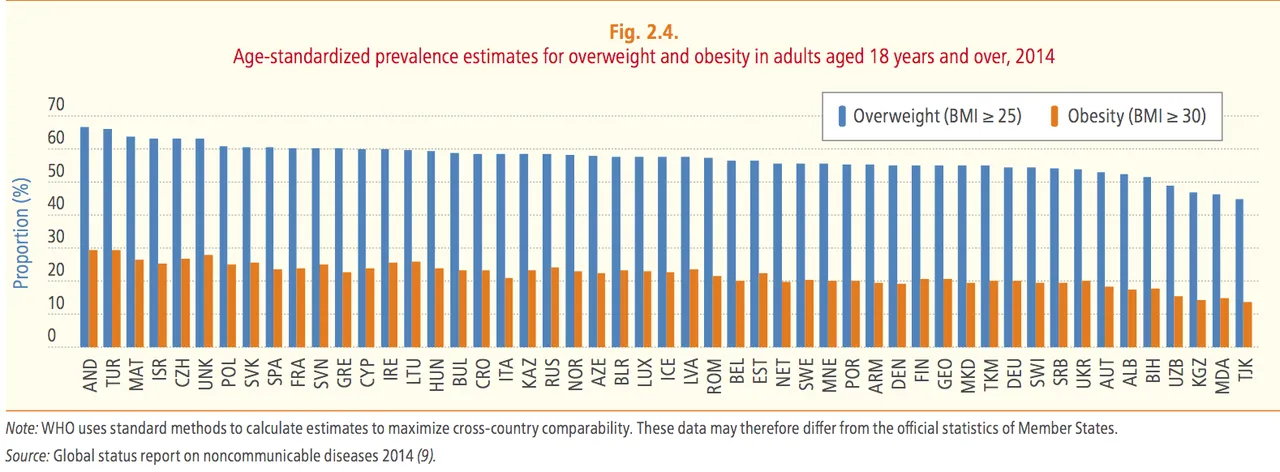
About overweight and obese people, the situation has worsened. In 2014, the prevalence of overweight persons – a body mass index (BMI) of 25 or above – in 51 countries in the European Region ranged from 44.9 percent to 66.9 percent, while the prevalence of obesity – a BMI of 30 or above – ranged from 13.6 percent to 29.5 percent. That means that in some countries 1 out of 3 of the inhabitants is obese. Its prevalence has tripled in many countries in the European Region since the 1980s.
The cost of non acting
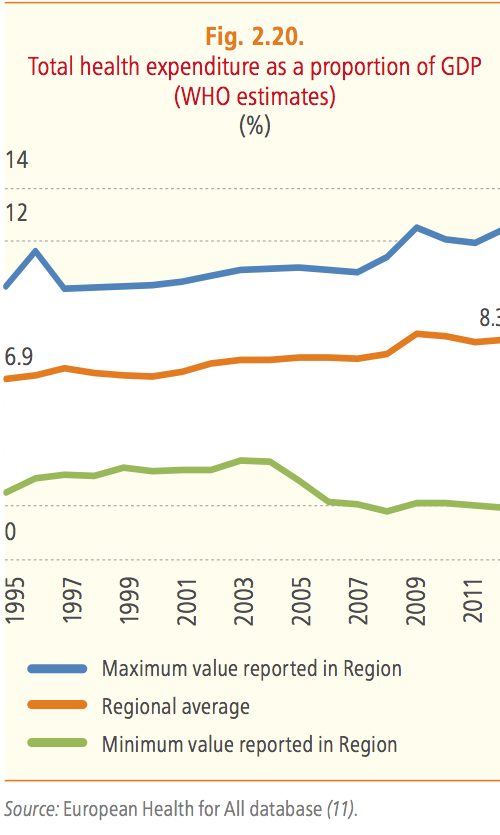
As WHO has stressed many times also during the latest RC in Vilnius, in healthcare there is also a cost for non acting. A universal health coverage is fundamental to achieve the Health2020 goals for the reduction of mortality and health inequalities. But actions need investments and during the last years the total health expenditure as a proportion of GDP across the European Region did not increase. The regional average has been more or less stable, at around 8.3 percent, since the 2010 baseline, and it represents today one of the most impressive example of social inequality. It differs considerably between countries in the European Region, ranging from 2.0 percent to 12.4 percent in 2012.
Through an elimination of selected vaccine-preventable diseases
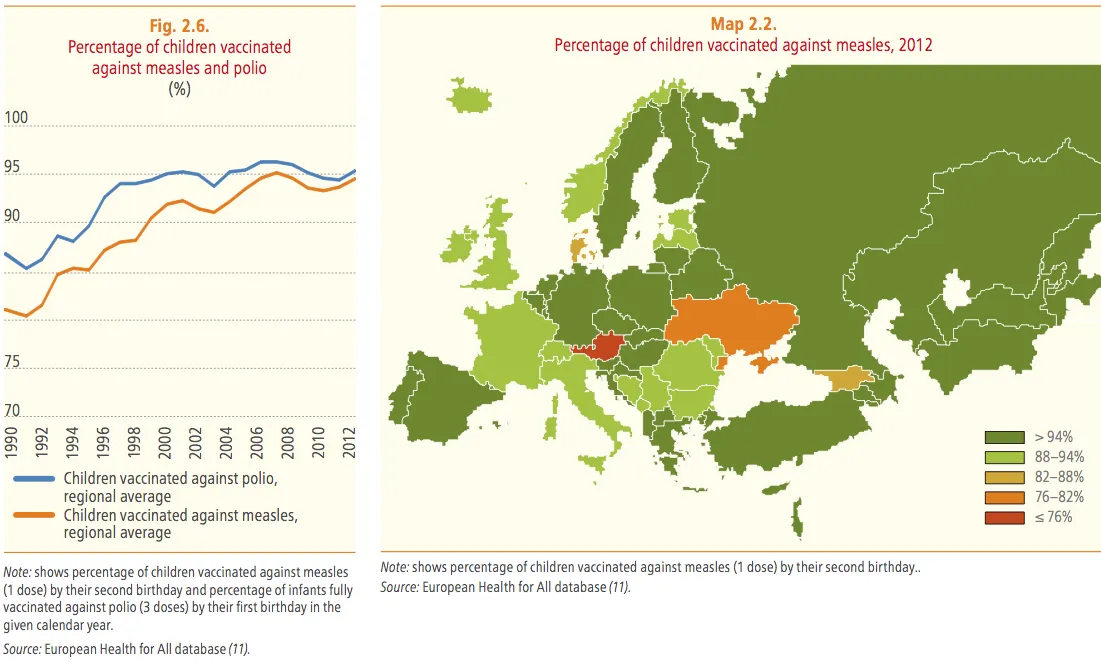
To conclude, health coverage also means immunization coverage. The second quantification for Health 2020 first target is the sustained elimination of selected vaccine-preventable diseases, for which the core indicator is the percentage of children vaccinated against measles, poliomyelitis and rubella. In general, there are good news: the average vaccination coverage for measles in the European Region increased in the last years, from 93.4 percent in 2010 to 94.6 percent in 2012, and the average vaccination coverage for polio was 94.7 percent. However – again – it is not true for all countries, as represented by the recent polio outbreak in Ukraine. More action is therefore needed to achieve the target of eliminating vaccine-preventable diseases, particularly focusing on closing immunity gaps in the population by improving subnational and second-dose coverage rates and by reaching specific population groups.
The Scienza in rete newsletter
Every week, free, science picked by hand: research, health, environment. Plus a comment on current events in the editorial by the editor, or by another of us, reserved for newsletter subscribers.