
Global warming confirmed by scientists
On Friday, 27 September, the Intergovernmental Panel on Climate Change (IPCC) gathered in Stockholm closed the Twelfth Session of Working Group I and approved the final document on the climate “Physical Science Basis”. The results fall close to the former IPCC report of 2007, and largely confirm the official previews released in the last days. The results rely on broader and more detailed observations, especially on regional scale, and on improved climate models (Earth System Models) simulations. The drawn conclusion highlights the same fact: global mean temperature keeps raising and human activities are the leading cause. Here the key points of the report:
Temperature
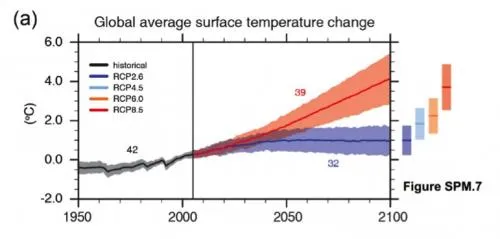
Global average temperature increased by 0.78°C since 1850 (linear trend analyses show an increase of 0.85°C). The last three decades have been successively warmer than any preceding decade since 1850. By 2100, global mean temperature can raise by 1-4°C compared to current values.
Ocean
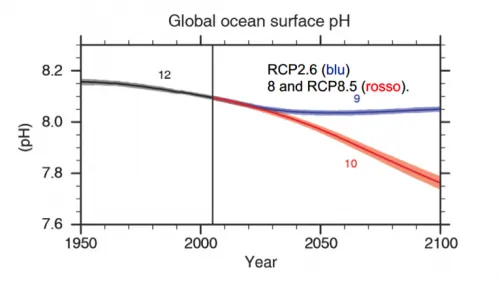
The ocean has been accumulated most of the heating in the climate system. Experts assessed “with high confidence” that the ocean’s heat absorption accounted for more than 90% between 1971 and 2010. In the same time range, the upper 75m warmed by 0.11°C per decade. The ocean has absorbed about 30% of carbon dioxide emitted by human activities, causing ocean acidification. The average pH of the oceanic surface decreased by 0.1. Ocean warming will last throughout 21st century. It will gradually expand to deeper ocean and it could affect ocean circulation systems. Without any mitigation strategy, the ocean PH could reach -7.8.
Glaciers and polar ice caps
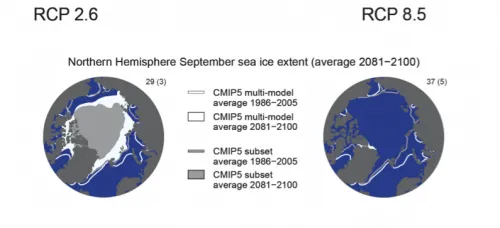
Experts assessed that over the last two decades, the Greenland and Antartic ice sheets have been losing mass, glaciers have continued to shrink almost worldwide, and Arctic sea ice and Northern Hemisphere spring snow cover have continued to decrease in extent. These trends are “very likely” to continue during the 21st century as global mean surface temperature rises.
Sea level
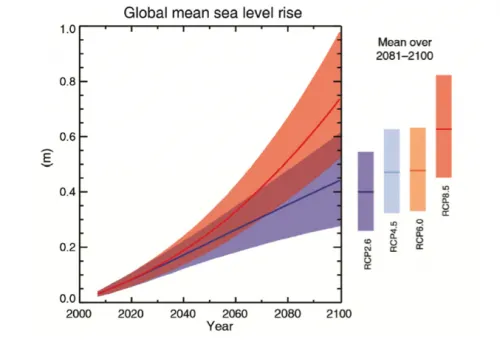
From 1901 to 2010 the sea level rose by 19 cm (average global estimation), with significant variation at the regional scale. The rate of sea-level rise since the mid-19th century has been larger than the mean rate during the previous two millenia. Sea level is expected to rise by 40-63 cm in the course of this century.
Concentration of greenhouse gases
The atmospheric concentration of carbon dioxide, methane and nitrous oxide have increased by 40% since pre-industrial period, reaching the highest level of the last 800000 years. From 1750 to 2011 fossil-fuels emissions released into the atmosphere 365 gigatonnes of carbon. Land-use change emissions (due to deforestation or forest-to-agriculture conversion) accounted for other 180 gigatonnes, resulting in a total of 545 gigatonnes of carbon from anthropogenic sources. Projections show that CO2 emissions by the end of this century will increase by 140 -1910 GtC, depending on future scenarios.
New scenarios
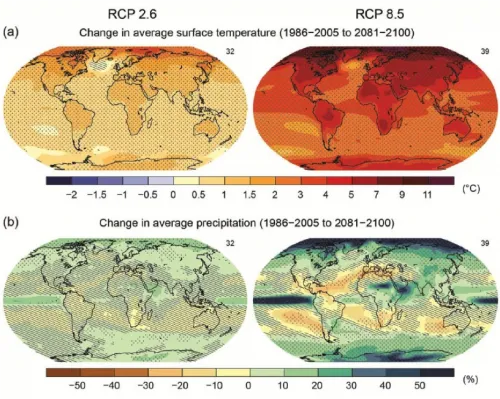
New categories replaced the SRES scenarios used in the former report (with the well-known BAU, or A1FI, representing the businness-as-usual). The brand-new scenarios are named Representative Concentration Pathways (RPCs) and for the first time include hypotheses of global mitigation action that will effectively reduce GHG emissions. The RCP2.6 scenario represents an “high mitigation” future, the RCP8.5 a “very high greenhouse gas emissions” option. Looking at Figures a) and b), it is easy to grasp that the difference between the two options is quite significant.
The Scienza in rete newsletter
Every week, free, science picked by hand: research, health, environment. Plus a comment on current events in the editorial by the editor, or by another of us, reserved for newsletter subscribers.